The Ultimate Personal Finance Dashboard
Do you ever get your credit card statement and say “What the *%&# “?
We are going to build the ultimate personal finance dashboard so you will never have to utter any 4-letter words again when the credit card bill arrives.
We’ll complete this project in multiple iterations. Each iteration will add more value and functionality.
- Create a basic dashboard from credit card exported data.
- Add in spending benchmarks on critical spending categories.
- Add saving goals
- Enhance the report by adding KPI’s to compare against the prior month
#1 – Create Dashboard Visualizations based on raw Credit Card Transactions
Every major credit card will have the ability to download transaction details from their website. For this project, we’ll be using sample credit card data for our first version of the dashboard. On a personal level, creating a dashboard similar to this one has made a huge difference in our family’s financial stress level. It has provided a repeatable method to manage our monthly spending – just by having a way to see what’s where money is going on a monthly basis. In a business, the same principle applies. A famous quote by Peter Drucker rings true “If you can’t measure it, you can’t improve it”.
See sample data below.
| Date | Purchaser Name | Category | Amount | Store |
|---|---|---|---|---|
| 2022-02-27 | Jane Doe | Groceries | 111.5 | Costco |
| 2023-01-21 | John Doe | Health & Beauty | 37 | Bath & Body Works |
| 2022-09-17 | John Doe | Utilities | 190.71 | Verizon |
| 2023-01-09 | John Doe | Health & Beauty | 24.97 | Sephora |
| 2023-09-05 | Jane Doe | Electronics | 330.08 | B&H |
| 2023-08-25 | John Doe | Health & Beauty | 354.07 | Bath & Body Works |
| 2022-04-24 | Jane Doe | Utilities | 314.7 | Verizon |
| 2023-01-24 | Jane Doe | Groceries | 396.82 | Trader Joe’s |
| 2023-12-08 | Jane Doe | Travel | 473.71 | Delta Airlines |
| 2023-12-22 | John Doe | Electronics | 379.6 | Newegg |
| 2023-03-06 | John Doe | Groceries | 452.36 | Whole Foods |
| 2023-09-13 | Jane Doe | Electronics | 74.57 | Microsoft Store |
| 2023-01-15 | Jane Doe | Travel | 279.25 | Uber |
| 2022-03-21 | John Doe | Dining Out | 60.36 | Olive Garden |
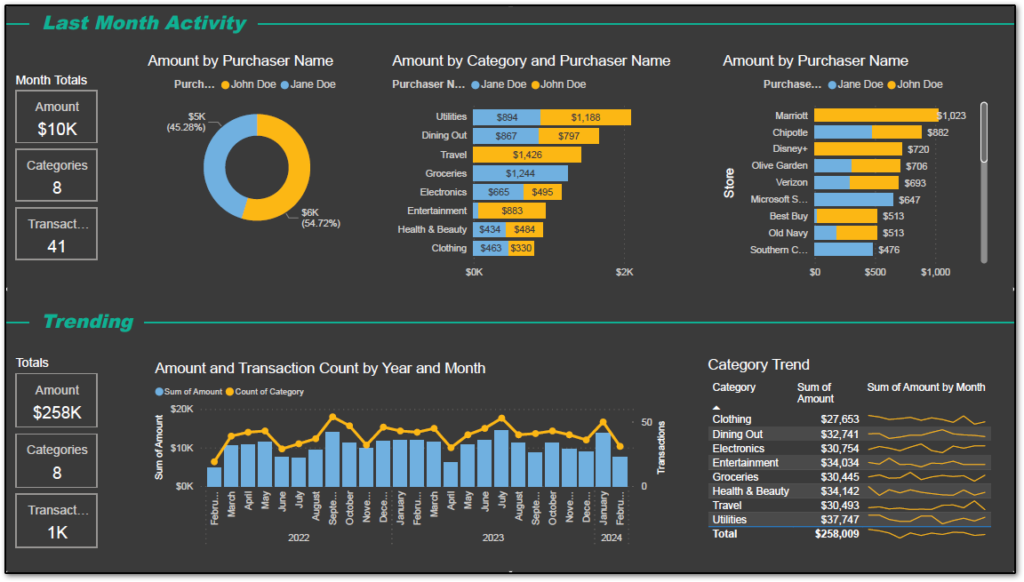
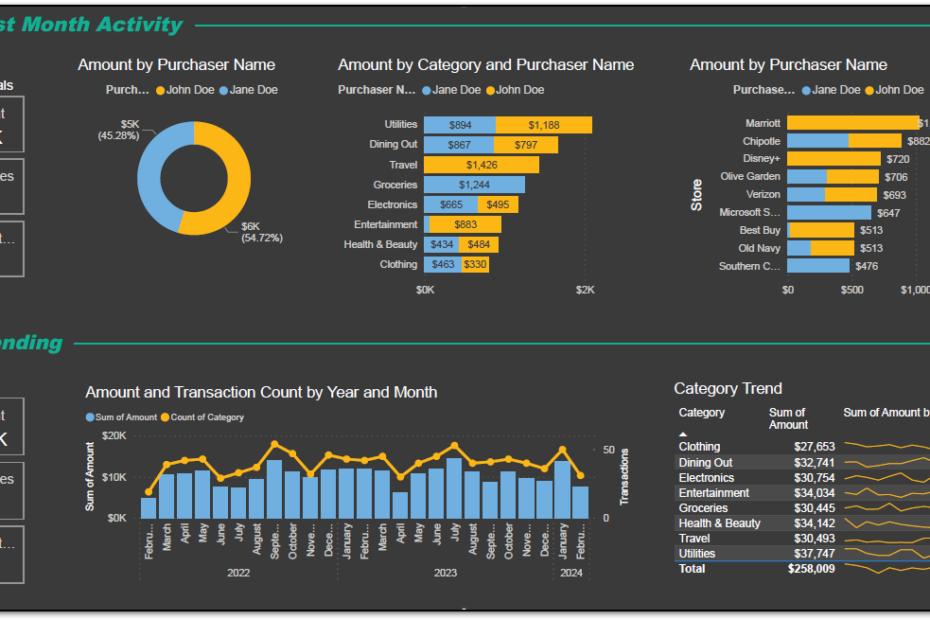
- The goal of the 1st version of our dashboard is simply to take raw data (credit card data) and transform it into a some visualizations (charts) to help our brains easily digest the information. We’ll be converting data into information – then we’re ready to see the insights, and take action!
- Below is the dashboard we’ll be building. Don’t be intimidated – if you can navigate your way around Excel, you can create this! AND somehow this incredible software is FREE!